Data.
At times, it can be a bit overwhelming.
And understanding it all is no simple task.
With our standard client kickoff process, we’ll often do a quick look at analytics data (typically Google Analytics) to view general web traffic numbers, traffic sources, engagement and conversion data. Within about 15 minutes, you can get a basic picture of the websites overall performance in a few key areas.
But oftentimes, the deep dive into analytics shows us issues we weren’t aware of at first: improper tracking installs, double tracked (or never tracked) conversion data, bad referral data and more. It can be a bit like opening Pandora’s box of company misinformation. Marketing thought that programing installed tracking tags on the new blog while programmers saved over a custom tracking install. Making errors during an analytics package install is pretty common – especially on sites with age where tracking codes may have been added under old Javascript standards or CMS have changed (more than once!).
Data pollution is common and is something that most companies never devote any type of budget for – when was the last time anyone brought up auditing their analytics install at a board meeting?
But, alas, there’s a better way to keep your eye on critical marketing and company data.
Enter analytics dashboards & Analytics Canvas. It’s a full-service tool for keeping tabs on revenue, web traffic, engagement and thousands of other data points.
It does not come cheap for the full desktop functionality. But, luckily, at the time of this post, you can get a lot of the great functionality of their reporting dashboard engine with a combo of the new Google Sheets and a new plugin.
The power of the plugin is pretty amazing: nearly any combo of data that you frequently check up on – like email marketing revenue the week after a database message or how many social visits occurred over the last 30 days can be made into a custom query and reported on. The default view in Google Analytics may be okay for people quickly checking for web visits, but for data-driven marketing professionals, decision makers and analysts, it’s not enough. Instead of poking around in analytics everyday where you have to re-add secondary dimensions for sorting, this sheet extension can create you an in-depth visual masterpiece that allows you to check in on critical company data.
It’s not just for owners, but for agencies too. How about a dashboard that creates an entry for every revenue-driven client that reports on their YOY revenue growth in a single sheet view? Yup, done that.
It may take some tweaking to get your analytics canvas just how you’d like – but don’t fret. Here’s a quick example of keeping an eye on page speed load times (an important usability factor of you website) along with a review of new visitor engagement metric data. Without a tool like this, you’d have to check in across three different tabs in Google Analytics.
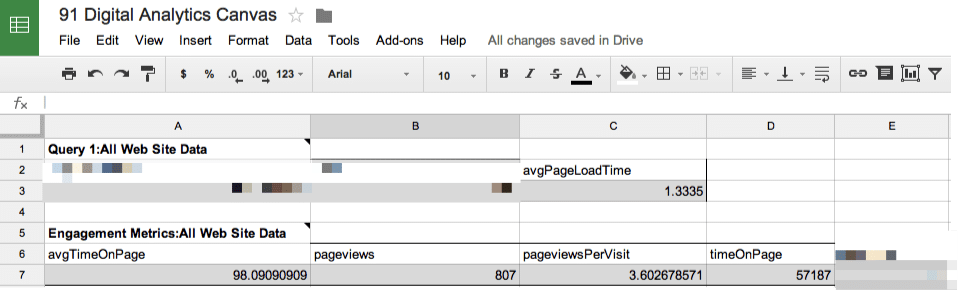
You can download the analytics canvas extension for sheets here. Let me know how well it works for your data-hungry needs.