
I get it: Google Analytics can easily overwhelm and confuse even the most data-loving accommodations marketer.
With a myriad of reports, views, filters, channels, sessions, users and pageview data visible in just a few clicks, there’s no doubt that you almost need an advanced degree just to understand what’s in front of you when you open Google Analytics.
While you cannot learn everything about Google Analytics in a single blog post (I’ve been using it for 6+ years and still learn new things frequently), hopefully I can cut through the noise and show you the top reports to know and understand for your business.
It’s become an all too common occurrence over the past two years that I’ve taken a look at Google Analytics for the first time with a brand new client and have found incorrectly setup tracking and reporting. While the “code was installed” for years, key data and information was never tracked inside of the Google Analytics interface. In short, the bare minimum won’t cut it with a tool like Google Analytics if your goal is to understand how leads and bookings happen on your website.
Setting up none of the goal and e-commerce tracking options turns Google Analytics from a highly sophisticated analysis tool into a glorified digital abacus.
Let’s make sure your tracking setup doesn’t suffer that fate…
Pre-Check: Confirming Google Analytics Tracking Is Installed Properly
Before we take any flight, the Pilots of the airplane perform a pre-check. The pre-check is made to confirm that everything is in working order before we take off and fly a metal tube 600 mph over 30,000 feet in the air with everyone’s life at stake.
Good idea, right?
It may slow us down a bit, but I’m very grateful that the pilots perform this pre-check. Before we start flying our data analysis plane, we’ll need to do our own pre-check.
Your goal with a simple Google Analytics tracking audit should be to to confirm:
- The tracking code is on each page
- The latest version of the tracking code is installed
- Settings are the correct for your website
- Key first-party tools are linked and data is flowing
- Tracking is authentic and true
Luckily for most websites, installing Google Analytics isn’t too hard of a task. Many software platforms like Liverez in the vacation rental space make installing the code as easy as pasting in a ID into a single field on your admin.
Other software platforms like Streamline Vacation Rental Software deploy their websites on WordPress and installing Google Analytics is as simple as pasting into a plugin like Headers & Footers.
No matter what platform you are using, working through this process on your own is fairly straightforward.
- Paste your domain into http://www.gachecker.com/ to make sure that code is installed on each page.
GA Checker automatically crawls each page of your website and makes sure that a .js tracking code is installed. Similar to other website crawl tools like Screaming Frog or Sitebulb, GA Checker can accomplish this task in just a few minutes.
Assuming that the code is installed on each page, make sure that the latest version of the tag is being used. In early 2018 Google switched to Global site tag (gtag.js) as the default tracking code for Analytics. If you’re using the older versions, it would be a good idea to switch.
- Audit your settings at https://analytics.google.com/analytics/web/ to make sure all of the settings are correct.
While I rarely see any major mishaps here, they can occur. Some of the top settings to review for accuracy:
- Under Property Settings –> Default URL: Make sure that HTTPS is showing here if your website is secure.
- Under Tracking Info –> Referral Exclusion List: Has your own domain or any third-party checkout domains listed.
- Under All Products –> Search Console: Make sure the proper version of your site is linked here. For example, the WWW & HTTPS version of this website is linked.
- Under View Settings –> Time zone country or territory: While not critical, you’ll want to make sure your correct TZ is set for any day parting analysis.
- Under View Settings –> Default page: 99.9999999% of the time you don’t need to touch this field. Setting this up wrong can ruin your data: use only when a trusted Google Analytics professional sets this up.
Table Stakes: Tracking Key Leads & Online Bookings In Google Analytics
Now that we’ve worked though our pre-check, we need to enhance the data to make future analysis far more useful. Accomplishing more useful tracking centers around tracking leads, key interactions and sales and pushing that data into Google Analytics. This is a topic I’ve actually covered before with this article on setting up the right goals in Google Analytics.
Tracking Leads & Key Interactions
Nearly every website has a few lead capture points already configured: a phone number, contact form or property inquiry form are common. Inside of Google Analytics you can track when a lead occurs by a few simple methods. I often reccomend using “thank-you” pages as the engine for tracking these goals due to the simplicity and ease across tracking between different analytics packages.
Put simply: every analytics tool you’ll ever use can use thank-you pages whereas complex .js event tracking is often custom per package. However, some software platforms prefer to use event tracking or .js to track leads and push that into Google Analytics. That’s alright, just confirm it’s tracking only submitted leads and not all form submissions (even ones with errors).
E-Commerce Tracking Setup (Working With Developers)
While setting up more advanced tracking can be difficult, it’s often the case that you’ll work with a website developer to configure this important tracking. Once complete, you’ll be able to report on all online bookings made on your website with ease.
Traffic Sources: Understanding The Google Analytics Channel Report
If you’ve made it this far: congrats! You’re tracking key interactions on your accommodations website and can truly start to analyze how different traffic sources perform and drive new leads and bookings.
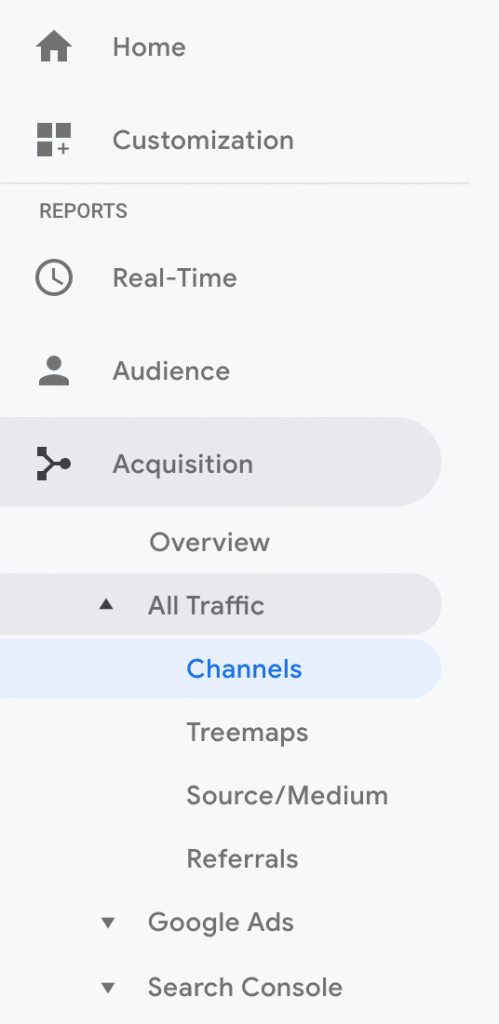
My favorite report for viewing how each source of traffic is doing at a high level is the Google Analytics Channel Report. The Channel Report shows:
- Each traffic source in large to understand buckets
- The performance of traffic grouped together
- A simple 5-7 channel view that can give you insight quickly
Let’s review an example report.
User Behavior: Reviewing The Top Pages On Your Site
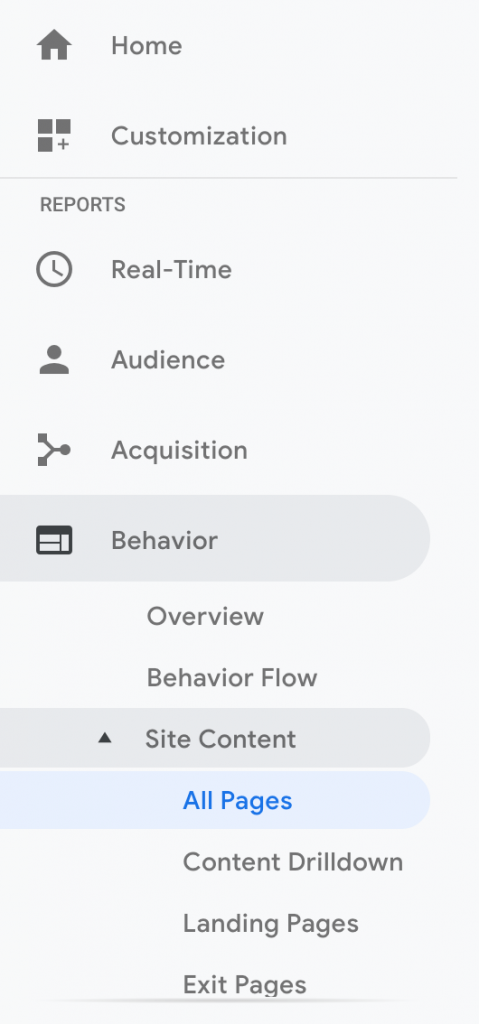
While the channel report is a high level overview of behavior, the top pages report is where that behavior happens. Understanding which pages on your site are viewed the most, landed on the most and left the most is key to understand.
For example, here’s where you can compare different landing pages on your website to see which is driving more traffic. For example, if you had a landing page for Pet Friendly Vacation Rentals and a page for Oceanfront Vacation Rentals, you’d be able to see which page is getting more traffic here.
Not only do you see key data like pageviews, you can also analyze key data about each page like bounce rate and conversion rate. Here is where you can often learn that there are pages on your site that may get 5% of the traffic, but 20-40% of conversions. This could be a property page or a page for a specific type of rentals or resort building you manage properties in.
Knowing that not all pageviews are made equal helps to prioritize marketing efforts too! Instead of assuming that anyone who comes to the website is a potential lead, you may learn that website visitors visiting 5-10 of your pages drives nearly all of your online bookings. Action item? Promote and drive more traffic to those pages!
Device Awareness: Mobile, Tablets & Desktop Behavior
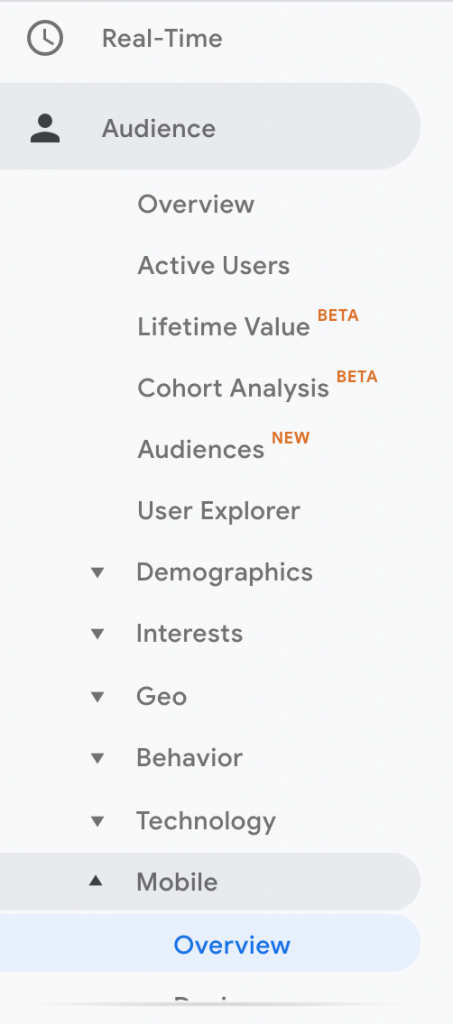
The last report can be summed up quickly: what types of devices are your visitors using to access the website. Many of my clients are often only accessing their websites from the desktop or laptop computers, completely unaware that perhaps 50 – 60% of traffic is on mobile.
While is this often the case (50%~ or so), each website is different. A beach resort that guests plan and research for months may actually see more tablet and desktop traffic while a quick ski trip destination may actually see upwards of 70% of mobile traffic.
Learning More About Google Analytics
While we couldn’t cover the dozens of reports that are common to use in Google Analytics, I hope this primer on the top reports to understand helped! If you’d like to audit your tracking setup and make sure you are setup properly, get in touch.